Articles
- Page Path
- HOME > Sci Ed > Volume 8(1); 2021 > Article
-
Original Article
Relationship between publication indicators and citation impact indicators for publications in business, management, and accounting listed in Scopus from 2015 to 2019 -
Hyunju Jang1,2

-
Science Editing 2021;8(1):18-25.
DOI: https://doi.org/10.6087/kcse.225
Published online: February 20, 2021
1Graduate School of Business, Sungkyunkwan University, Seoul, Korea
2Research Intelligence, Elsevier Korea, Seoul, Korea
- Correspondence to Hyunju Jang iamjhj1014@skku.edu
Copyright © 2021 Korean Council of Science Editors
This is an open access article distributed under the terms of the Creative Commons Attribution License (http://creativecommons.org/licenses/by/4.0/), which permits unrestricted use, distribution, and reproduction in any medium, provided the original work is properly cited.
Abstract
-
Purpose
- This study examined whether article-level publication indicators were related to citation impact indicators in the business, management, and accounting categories listed in Scopus. Article-level publication indicators included the number of authors, countries, and keywords, as well as title length, while citation impact indicators included the field-weighted citation impact (FWCI) at the article level and Scimago Journal Rank (SJR) at the journal level. The optimal values of four article-level publication indicators for maximizing the FWCI and SJR were calculated.
-
Methods
- All publication and citation impact indicators were gathered for articles and reviews in the business, management, and accounting fields published from 2015 and 2019 and listed in Scopus and SciVal. Correlations between four article-level citation indicators and each citation impact indicator were analyzed.
-
Results
- The number of authors was positively associated with the FWCI, while the number of countries and keywords was not associated with the FWCI or SJR. Title length was negatively associated with the FWCI and SJR. The optimal publication indicators to maximize the FWCI were four authors, three more countries, six keywords, and a title word count of 14 to 19. The optimal publication indicators to maximize the SJR were three to four coauthors, three to four countries of collaborators, five keywords, and a title word count of two to seven.
-
Conclusion
- Authors aiming to get higher citations and publish in higher-ranking SJR journals in the business, management, and accounting categories are recommended to pay close attention to design of research team and the number of keywords and impactful title length so that the publication will have a higher likelihood of being accepted and receiving citations.
- Background/rationale: As the evaluation of research performance has shifted its focus from quantity to quality, citations have received considerable attention as an indicator of quality. Citation counts, as a way to measure impact, are widely acknowledged as the leading indicator used to assess the impact of scientific research, researchers, institutions, countries, and journals [1], although using citations to evaluate the quality of research has been criticized [2]. At many research institutions, citation impact has been linked with winning awards and professional recognition (e.g., recruitment, promotion, and incentives). Moreover, universities with a strong interest in university ranking have paid particular attention to citation impact, which has been employed as an evaluation indicators for the world, Asia, and subject rankings by QS (Quacquarelli Symonds), THE (Times Higher Education), and Academic Ranking of World Universities.
- Citation impact is an indicator based on an analysis of the citations received by publications [3]. This indicator can be used to establish specific criteria for the performance of publications, researchers, and institutions compared to each other or a world average [4].
- Over the years, empirical studies have attempted to determine publication indicators, including open access, international collaboration, number of authors, journal impact, reference impact, and view count. These are associated with citation impact and focus on specific journals or subject areas such as science, technology, and medicine in relation to countries [5-7].
- Objectives: This study aimed to examine whether the number of keywords, title length, and the number of authors and their countries were related to citation impact indicators, including the field-weighted citation impact (FWCI) at the article level and the Scimago Journal Rank (SJR), in the fields of business, management, and accounting (BUSI) from 2015 to 2019 based on Scopus and SciVal.
- We expect to provide researchers and publishers interested in the citation impacts of publications with valuable insights concerning strategic submissions, effective research team organization, and related decision-making.
Introduction
- Ethics statement: This study did not include human subjects, so neither approval by the institutional review board nor informed consent was required.
- Study design: This was a bibliometric study based on a literature database.
- Setting/data sources/variables: Literature data, including 206,819 articles or reviews from the BUSI fields published from 2015 to 2019, were extracted on September 30, 2020, from Scopus [8] and SciVal [9]. Data on the FWCI were collected from Scopus and SciVal (Dataset 1).
- The publication indicators included the number of authors, the number of countries of collaborating authors, the number of authors’ keywords, and title length. The citation impact indicators included the article’s FWCI and the journal’s SJR. The FWCI is an indicator of mean citation impact that compares the actual number of citations received by a document with the expected number of citations for documents of the same document type (article, review, book, or conference proceeding), publication year, and subject area [3]. The SJR is a sizeindependent metric aimed at measuring the current average prestige per paper of journals for use in research evaluation processes [10]. The goal of this study was to provide evidence as to which of these variables are related to FWCI and SJR.
- Bias: There was no bias in selecting the data for analysis.
- Study size: All target journal articles in Scopus were included; therefore, there was no need for an estimate of the sample size.
- Statistical method: The results are presented according to descriptive statistics. The relationship between publication indicators and citation impact indicators was investigated through a correlation analysis. IBM SPSS Statistics ver. 20.0 (IBM Corp., Armonk, NY, USA) was used for statistical analysis.
Methods
- Growth of publications and changes in the four indicators
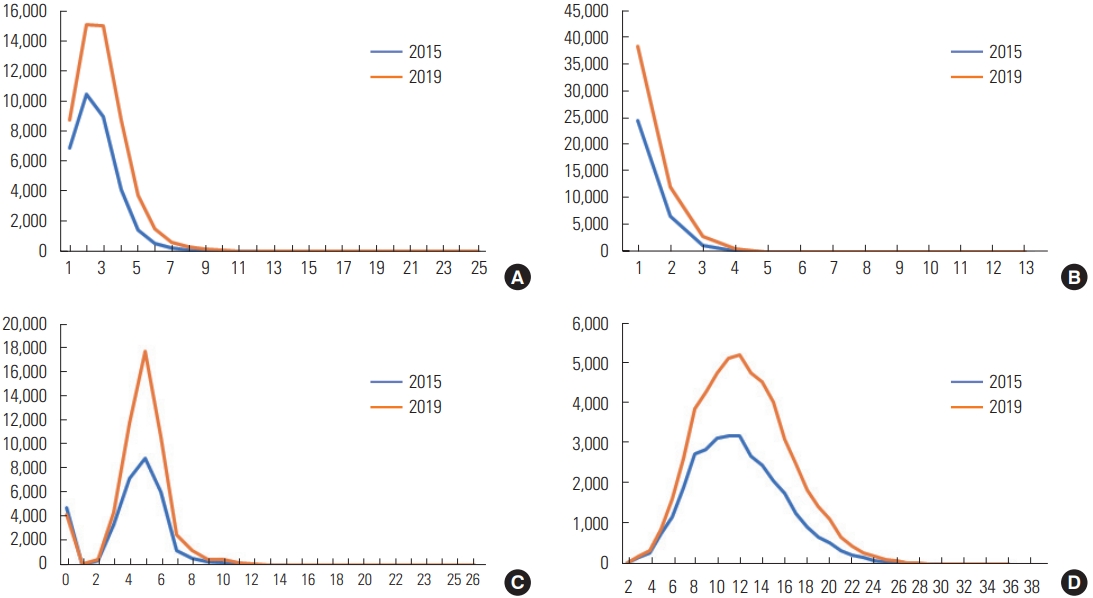
- The average annual growth rate of publications in BUSI from 2015 to 2019 was 13.3%. The number of articles per year was 32,875 in 2015, 36,007 in 2016, 39,598 in 2017, 44,117 in 2018, and 54,222 in 2019. The publication indicators such as the number of authors, countries, keywords, and title length per publication increased by an average of 2.8%, 1.9%, 2.9%, 1.0%, respectively, while the four indicators increased by 11.5%, 7.7%, 11.9%, and 4.2%, respectively, from 2015 to 2019 (Fig. 1, Table 1, Suppl. 1).
- Relationships between publication indicators and FWCI
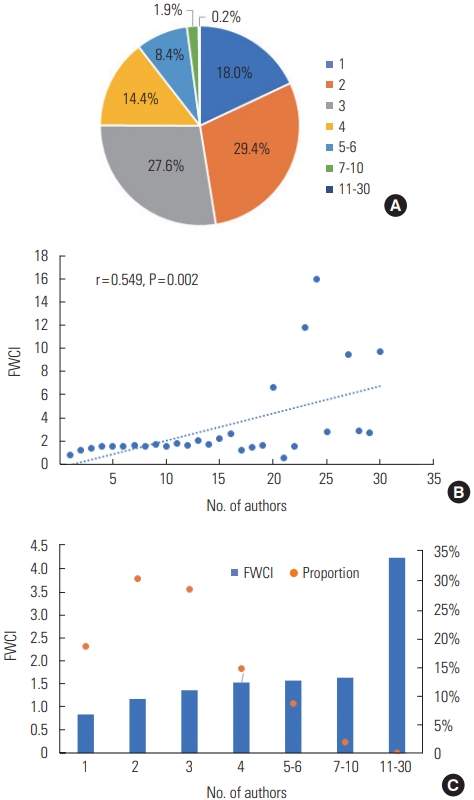
- Number of authors: The proportion of articles with fewer than 10 coauthors was 99.8%. The most common number of coauthors per publication was two (29.4%), followed by three (27.7%), one (17.9%), and four (14.5%). The number of authors per article showed a positive correlation with the FWCI (r= 0.549, P= 0.002). The FWCI increased to 1.19 for two coauthors and rose linearly up to 1.53 for four coauthors, but then remained similar up to 10 coauthors. The highest FWCI (4.23) was found for articles with 11 or more coauthors, but this category only accounted for 0.2% of publications, so it was interpreted as an exceptional case. Therefore, in the case of four coauthors was found to have the most positive effect on the citation (Fig. 2, Suppl. 2).
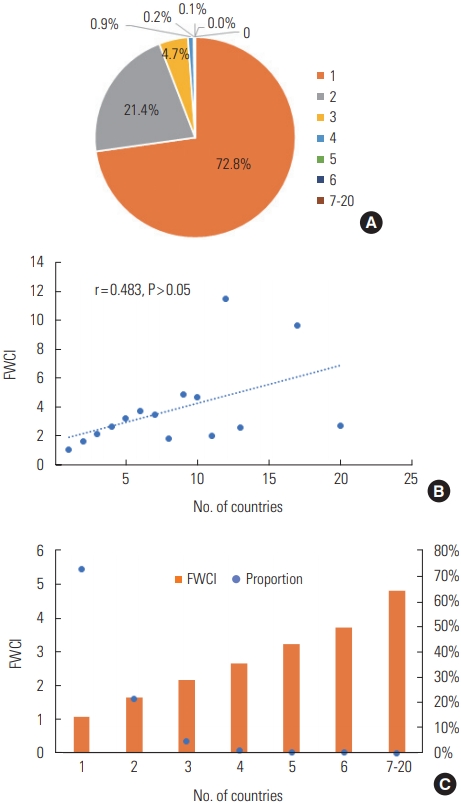
- Number of countries: The proportion of articles with international collaboration among researchers from up to 20 countries was 27.2%. The highest proportion of articles had authors from a single country (72.8%), followed by two countries (21.4%), three countries (4.7%), and four countries (0.9%). The FWCI increased by 51.3% if there was collaboration between authors from two more countries and by 100.6% when there were collaborators from three or more countries. The FWCI of papers with collaborators from seven to 20 countries was the highest, at 4.81, but the proportion of these collaborations was very low (0.04%), so it was difficult to interpret meaningfully. A positive, but non-significant correlation was found between the number of countries and the FWCI (r= 0.483, P> 0.05). As most papers were published by authors from a single country, and only 1.2% of articles were authored by collaborators from four or more countries the number of countries poorly predicted the FWCI of publications. Nonetheless, collaboration by authors from three or more countries was estimated to be relatively useful for citation impact (Fig. 3, Suppl. 2).
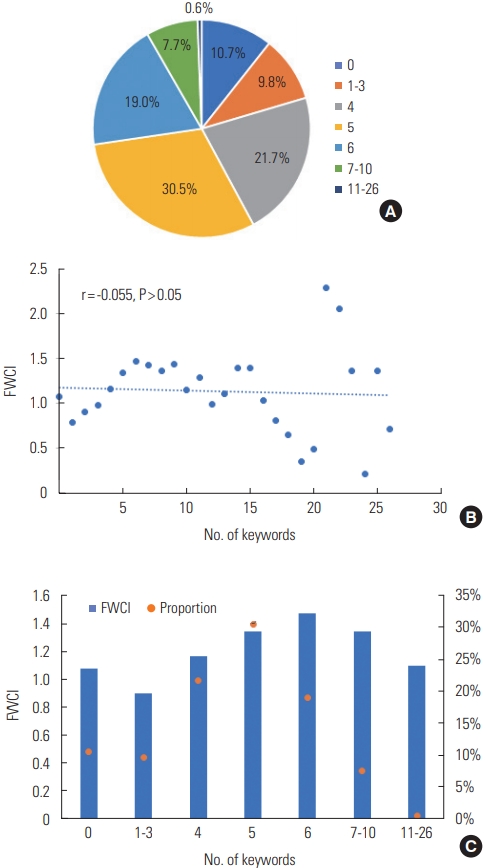
- Number of keywords: The number of keywords ranged from 0 to 26. The most common number of keywords was five (30.5%), followed by four (21.7%) and six (19.0%), in an analysis limited to seven groups. There was no meaningful correlation between the number of keywords and the FWCI (r= -0.055, P> 0.05). The FWCI of articles with six keywords was the highest (1.47), followed by that of articles with seven to 10 keywords (1.35) or five keywords (1.34). Publications that provided six keywords attracted more attention and citations (Fig. 4, Suppl. 2).
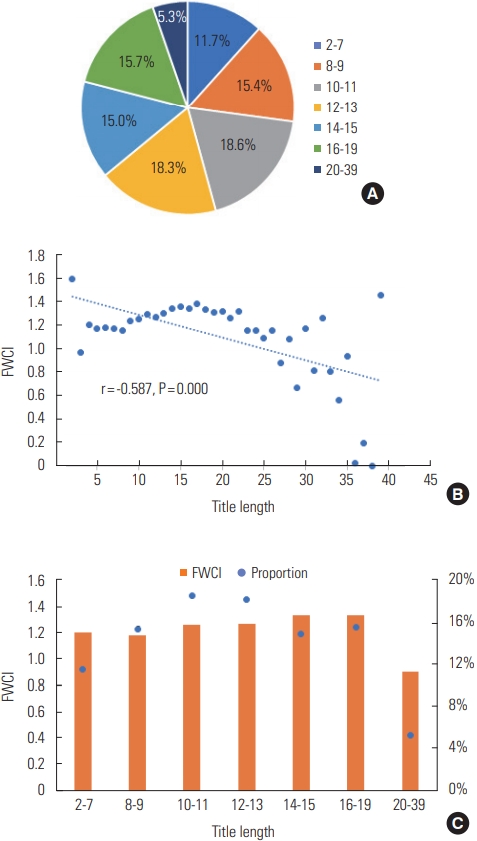
- Title length: The title length by publication ranged from two to 39 words. The proportion of articles with a title length of fewer than 30 words was 99.9%. The proportion of articles with a title length of 11 or 12 words was the highest (9.6%), followed by that of articles with titles containing 13 words (8.7%) and nine or four words (8.0% each). Title length was negatively associated with the FWCI (r = -0.587, P = 0.000). When the title length was greater than 10 words, the FWCI increased to 1.27. If the title length consisted of 14 to 15 words or 16 to 19 words, the FWCI was highest (1.34). Therefore, a title length of 14 to 19 words is expected to be most effective for citations. Furthermore, not exceeding 19 words in the title will help articles receive more attention from researchers (Fig. 5, Suppl. 2).
- Relationships between publication indicators and SJR
- Number of authors: As the number of authors of publications increased, there was a tendency for papers to be published in journals with higher SJR. However, the results were not statistically significant (r= 0.264, P> 0.05) . Publications with a single author were published in journals with the lowest SJR (0.8). Publications with three authors tended to be published in the highest-impact journals (1.20). The SJR for articles with four authors was 1.19, that of publications with five or six authors was 1.08, and that of articles with 11 to 30 authors was 1.20, which was the same as for articles with three authors. However, as only 0.2% of publications had 11 to 30 authors, this finding is not considered meaningful. In short, articles with three to four authors had a more favorable distribution regarding the SJR (Fig. 6, Suppl. 2).
- Number of countries: Papers written by authors from a single country had the lowest SJR (0.94), with the analysis limited to articles published by authors from seven or fewer countries. The SJR was higher (1.37) for articles with collaborators from two countries, and the highest SJR (1.80) was found for articles with authors from four countries. The SJR then decreased as the number of countries increased further. Thus, the SJR was highest for articles written by authors from three to four countries (Fig. 7, Suppl. 2). Nonetheless, the correlation was not statistically significant (r= 0.436, P> 0.05).
- Number of keywords: As journals’ editorial policies state the number of author-provided keywords for a publication, authors should follow the guideline. The number of keywords was not meaningfully correlated with the SJR (r = -0.019, P> 0.05). Limiting the analysis to articles with seven or fewer keywords, it was found that the SJR of journals with no keywords was 1.07, and the SJR was lowest (0.79) for those with one to three keywords. When there were five keywords, the SJR was 1.14, and it decreased to 1.07 when there were six keywords (Fig. 8, Suppl. 2). In other words, journals that included publications with five keywords showed the highest SJR. These high-quality journals manage and maintain the policy of allowing five keywords through their editorial policies.
- Title length: Unlike keywords, title length can be decided by the authors, although editorial policies also provide guidelines; thus, title length reflects both authorial intention and journal policy. The title length was negatively associated with the SJR. The SJR was 1.42 for journals with a title word count of two to seven (r= -0.811, P= 0.000). The SJR decreased for title word counts of eight or nine to 1.03. The SJR increased to 1.10 for journals with a title word count of 14 to 15. Journals with a high SJR were found to use impactful shorter titles with two to seven words (Fig. 9, Suppl. 2).
Results
- Interpretation: This study measured publication indicators related to the citation impact of articles in the BUSI fields from 2015 to 2019. The number of authors per article was positively related to the FWCI; in contrast, the number of countries, the number of keywords and title length were negligibly or negatively related to the FWCI and SJR. Along with an annual growth rate of articles in BUSI of 13.3%, the number of authors, the number of countries, the number of keywords, and title length increased by 11.5%, 7.7%, 11.9%, and 4.2%, respectively from 2015 to 2019. The rise in the number of authors and participating in research teams, and the increasing diversity of those teams in terms of cross-national collaboration, may reflect an increasing number of researchers and closer collaboration between countries. It was also observed that the number of keywords and article length tended to increase, with the addition of subtitles following semicolons to differentiate articles from previous research, compete with similar articles, and increase articles’ visibility. However, a tendency was found for articles with longer titles to receive less interest and fewer citations. This result implies that authors should write articles with short and impactful titles.
- Limitation: This research and results are limited to the specific fields of BUSI. Thus, future research should evaluate the citation impact of articles from different subject areas to determine the essential publication indicators for increasing the citation impact. Research should also investigate other diverse determinants, including new methodologies, while also incorporating interviews with researchers.
- Conclusion: Researchers in the BUSI area should consider the design of the research team strategically in terms of the organization of the number of authors and countries to conduct research effectively and produce the best results. Moreover, researchers should try to seek opportunities to participate actively in international collaboration projects and maintain networks and receive strategic support from their institutions to organize research teams. Journals with a higher SJR index tend to have editorial policies regulating the number of keywords and title length. Therefore, when submitting papers to higher-SJR journals, authors should pay close attention to the number of keywords and impactful title length so that the publication will have a higher likelihood of being accepted and receiving citations.
- Authors who would like to publish papers in higher-ranking SJR journals in the business, management, and accounting categories are recommended to consider a research team of three more coauthors from multiple countries. To maximize the citation impact, four authors should be considered, with collaboration by researchers from at least two countries. The implication for authors or publishers in BUSI is that they need to properly understand citation impact indicators. Understanding the relationship between article-level publication indicators and citation impact indicators would assist in the development of plans to conduct more strategic research and increase their articles’ impact and visibility.
Discussion
-
Conflict of Interest
No potential conflict of interest relevant to this article was reported.
-
Funding
The author received no financial support for this article.
-
Data Availability
Dataset file is available from: the Harvard Dataverse at: https://doi.org/10.7910/DVN/0I1MVR
Dataset 1. Raw data of publication indicators of articles and citation impact indicators in the category of business, management, and accounting listed in Scopus from 2015 to 2019
Notes
Supplementary Material
Suppl. 1.




- 1. Aksnes DW, Langfeldt L, Wouters P. Citations, citation indicators, and research quality: an overview of basic concepts and theories. SAGE Open 2019;9:215824401982957. https://doi.org/10.1177/2158244019829575. Article
- 2. Callaway E. Beat it, impact factor! Publishing elite turns against controversial metric. Nature 2016;535:210-1.https://doi.org/10.1038/nature.2016.20224. ArticlePubMed
- 3. Purkayastha A, Palmaro E, Falk-Krzesinski HJ, Baas J. Comparison of two article-level, field-independent citation metrics: Field-Weighted Citation Impact (FWCI) and Relative Citation Ratio (RCR). J Informetr 2019;13:635-42.https://doi.org/10.1016/j.joi.2019.0012. Article
- 4. Bornmann L, Bowman BF, Bauer J, et al. Bibliometric standards for evaluating research institutes in the natural sciences. In : Cronin B, Sugimoto C, editors. Beyond bibliometrics: harnessing multidimensional indicators of scholarly impact. Cambridge, MA: MIT Press; 2014:201-23.
- 5. Gazni A, Sugimoto CR, Didegah F. Mapping world scientific collaboration: authors, institutions, and countries. J Am Soc Inf Sci Technol 2012;63:323-3.https://doi.org/10.1002/asi.21688. Article
- 6. Jang H, Chun KW, Kim H. Comparison between Korean and foreign authors concerning the citation impact of Korean journals indexed in Scopus. Sci Ed 2019;6:47-57.https://doi.org/10.6087/kcse.147. Article
- 7. Bramoullea Y, Ducto L. Title length. J Econ Behav Organ 2018;150:311-24.https://doi.org/10.1016/j.jebo.2018.01.014. Article
- 8. Scopus. Expertly curated abstract & citation database [Internet]. Amsterdam: Elsevier; [cited 2020 Oct 23]. Available from: https://www.elsevier.com/solutions/scopus.
- 9. SciVal. SciVal: research performance insights on thousands of institutions, worldwide [Internet]. Amsterdam: Elsevier; [cited 2020 Oct 23]. Available from: https://www.elsevier.com/solutions/scival.
- 10. Gonzalez-Pereira B, Guerrero-Bote VP, Moya-Anegon F. A new approach to the metric of journals’ scientific prestige: the SJR indicator. J Informetr 2010;4:379-91.https://doi.org/1016/j.joi.2003.002. Article
References
Figure & Data
References
Citations

- The impact of qualitative methods on article citation: an international business research perspective
José Satsumi López-Morales, Héctor Francisco Salazar-Núñez, Claudia Guadalupe Zarrabal-Gutiérrez
Scientometrics.2022; 127(6): 3225. CrossRef

 KCSE
KCSE
 PubReader
 ePub Link
 Cite
Cite
