Proposal of the S-score for measuring the performance of researchers, institutions, and journals in Indonesia
Article information

Abstract
This study aimed to propose a tool for measuring the research performance of researchers, institutions, and journals in Indonesia based on bibliometrics. Specifically, the output of this measurement tool, referred to as the S-score, is described, as well as its implementation on the main database portal in Indonesia. The S-score was developed by a focus group discussion. The following 8 evaluation items for journal accreditation were analyzed in the development process: journal title, aims and scope; publisher; editorial and journal management; quality of articles; writing style; format of PDF and e-journal; regularity; and dissemination. The elements of the S-score are as follows: number of journal article documents in Scopus, number of non-journal-article in Scopus, number of citations in Scopus, number of citations in Google Scholar, the h-index in Scopus, and the h-index in Google Scholar. The S-score yields results ranging from S1 to S6. The above metrics were implemented on the Science and Technology Index, a database portal in Indonesia. The measurement tool developed through the focus group discussion was successfully implemented on the database portal. Its validity and reliability should be monitored consistently through regular assessments of S-scores. The S-score may be a good example of a metric for measuring the performance of researchers, institutions, and journals in countries where most journals are not indexed by Scopus.
Introduction
Universities in Indonesia are growing rapidly. As of February 6, 2017, there were 4,498 colleges with 268,322 lecturers (Table 1) [1]. The Ministry of Research, Technology and Higher Education, as well as most universities and research institutions in Indonesia, used the Scopus and Web of Science databases to evaluate the research performance of Indonesian researchers as of 2017 [2]. Indonesia has not developed its own measurement tool for research performance that can be used by policy-makers to evaluate researchers, institutions, researchers, and journals in various research fields [3]; therefore, a new measurement tool for assessing research performance in Indonesia is required. This study aims to propose a new metric, referred to as the S-score, to measure the research performance of researchers, institutions, and journals in Indonesia. This study proposes specific models, indicators, and metrics, and provides the results of the implementation of these metrics on a database portal. The results will be useful for countries where many journals are not indexed in international citation databases, such as Scopus or Web of Science.

Number of universities, students, and lecturers in Indonesia in 2017
Measurement Tools
This tool for measuring research performance was proposed through a focus group discussion in 2017. The expert group identified indicators based on the research products of researchers and their citation frequency in Scopus and Google Scholar. The indicators and evaluation items were proposed for measuring the performance of not only authors but also of institutions. Journals’ performance was measured by taking data from Indonesian journals indexed in Scopus, the Indonesia national journal accreditation system, and citation frequency in Google Scholar. Based on these evaluation items, the S-score was proposed.
Data on research products from all lecturers and researchers in Indonesia were collected and entered into the Science and Technology Index (SINTA, http://sinta2.ristekdikti.go.id/author) portal. The data collected from journals were matched through the Indonesian national accredited journal database (http://arjuna.ristekdikti.go.id/). The performance of researchers, institutions, and journals was presented in SINTA.
Results
Indicators and evaluation items
Table 2 presents the following evaluation items, contents, and scores used for journal accreditation by the Indonesian government: journal title, aims and scope; publisher; editorial and journal management; quality of articles; writing style; format of PDF and e-journal; regularity; and dissemination [4]. An explanation of constants and how they are weighted to calculate the S-score is presented in Table 3: A, number of journal article documents in Scopus; B, number of non-journal-article documents in Scopus; C, number of citations in Scopus; D, number of citations in Google Scholar; and N, current divisor. The measurement items used to evaluate the performance of researchers, institutes, and journals are presented in Fig. 1.

Evaluation items for journal accreditation by the Indonesia government

Explanation of constants used to calculate the S-score suggested for measuring the performance of authors and institutes in Indonesia
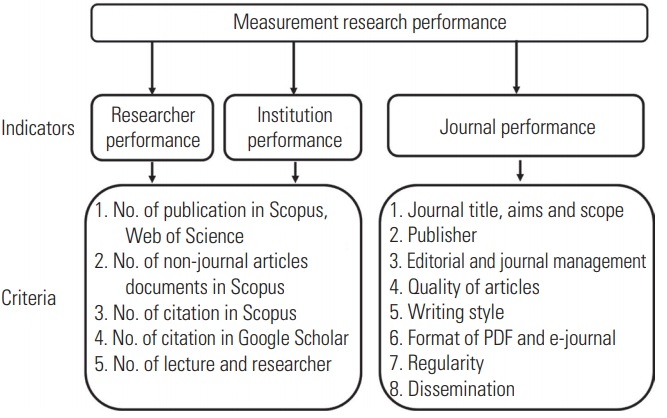
Indicators and their evaluation items in Indonesia.
S-score and metrics for performance measurement
The S-score, which incorporated metrics for authors and institutions, was formulated by weighting factors, as shown in Table 3. The indicators and items for measuring research performance were formulated in two scenarios, which were expressed as formula 1 and 2. The first scenario of the S-score formula for researchers, without the h-index, was as follows:
The second scenario of the S-score formula for researchers, with the h-index, was as follows:V
The S-score formula for institutions was as follows:
If we use the maximum SINTA score of a researcher on January 31, 2017 as the divisor (N), its value would be 102. The corresponding graph is shown in Fig. 2. The results of the measurements of author performance for all authors and institutions can be accessed at http://sinta2.ristekdikti.go.id. The results of the performance measurement will dynamically depend on the author registration process and data verification. The S-score for measuring the performance of journals is classified into a range of S1–S6, as measured by the values of the 8 criteria used for the accreditation of Indonesian journals, as presented in Table 2. The results of the classification by scores (S1–S6) can be seen in Table 4.
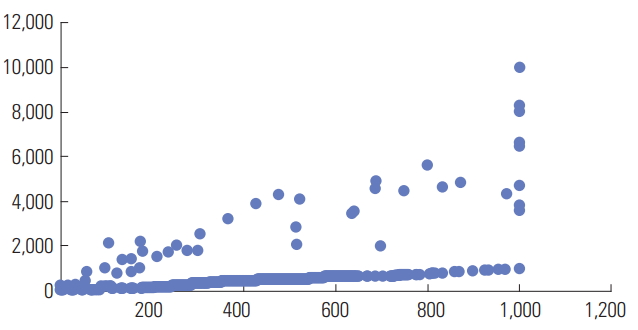
Maximum Science and Technology Index score of researchers on January 31, 2017.

Accreditation classification of journals published in Indonesia adopted by the portal Science and Technology Index
Integration of metadata into the model
The emergence of electronic journals and open access publishing has improved accessing digital data for each article, so that such data can be measured and made interoperable with various databases and indexers such as Scopus, Web of Science, Google Scholar, and others. Currently, thousands of Indonesian journals have been published in electronic form, and most journals are open access [5]. This study proposed a new model for integrating existing data in the Scopus and Google Scholar databases to measure research performance in Indonesia through the Scopus API (application programming interface) data retrieval mechanism, which can be incorporated into SINTA as shown in Fig. 3. A model of mapping and visualizing research performance based on data already entered into SINTA databases can be seen in Fig. 4. Mapping performance evaluation results in such a way can show profiles and ratings of researchers, institutions, and journals.
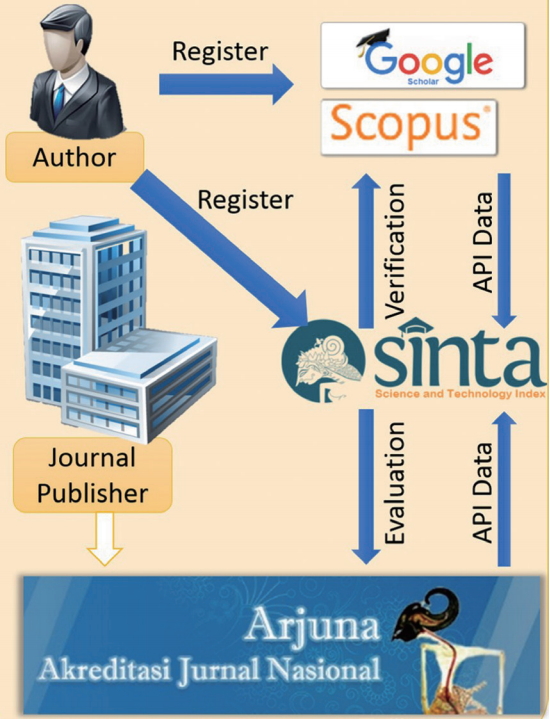
Model of data integration in Indonesia.
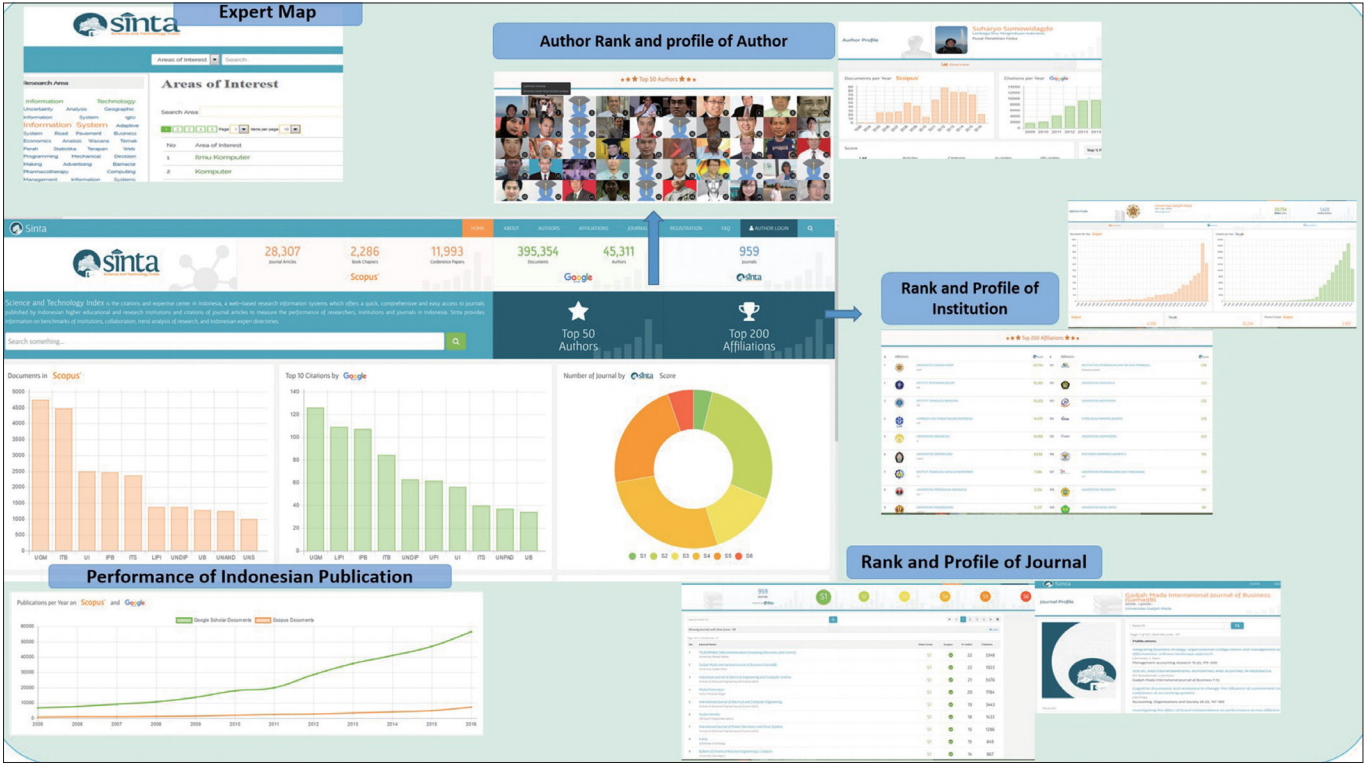
Model of performance mapping model in Indonesia.
Implementation and data verification
The resulting indicators, formulas, and models were then tested against registered lecturers with a national lecturer number (NIDN) at universities and researchers listed as functional investigators at research institutes. Lecturers and researchers simply fill out the registration form at SINTA (http://sinta2.ristekdikti.go.id/author/) by filling in the lecturer’s identification number (NIDN/unique number of employee), name, title, Scopus identifier and Google Scholar identifier. Lecturers and researchers who sign up can correct any discrepancies in publication data and the impact after synchronization, metadata in Google Scholar and Scopus, as shown in Fig. 5. As of June 30, 2017, registered authors have verified as many as 32,218 publications based on 25,472 data points harvested from 1,424 institutions. The number of journals evaluated was 995 of the 1,807 journals registered through the Arjuna portal (http://arjuna2.ristekdikti.go.id/). Information on the implementation of journal performance metrics in SINTA is available from: http://sinta2.ristekdikti.go.id/journals. Journal profiles have been created on that site based on citation performance, with h-index values taken from Google Scholar; this information is available at http://sinta2.ristekdikti.go.id/journals/detail?id=664.
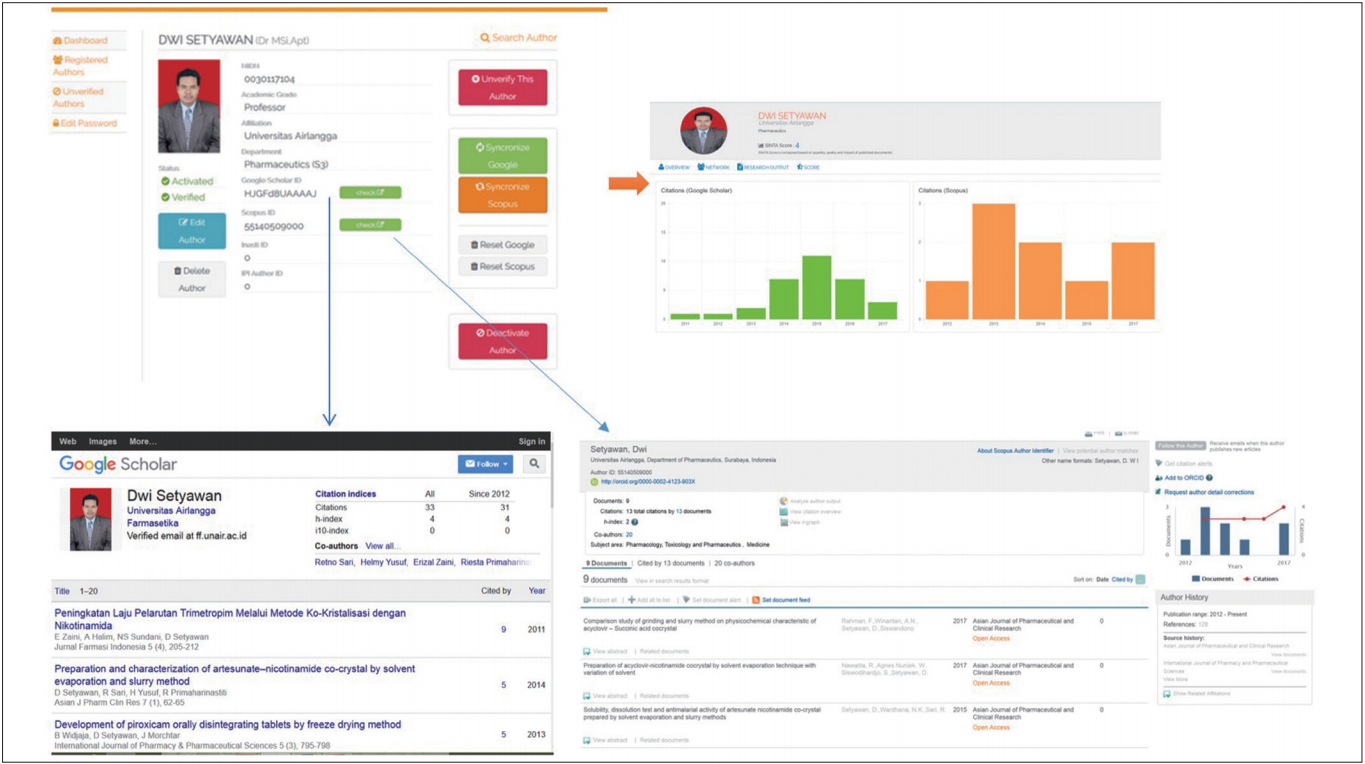
Mechanism of author verification and data collection in Indonesia.
Meaning of New Metrics and Its Limitations
This study proposed a new metric, referred to as the S-score, to measure the performance of researchers, institutions, and journals based on a set of evaluation items. The S-score was successfully implemented in SINTA as a way to present performance results. Most evaluation items were designed through a focus group discussion. The opinions of an expert group are an important component of the development of new metrics or a novel evaluation system in a country because the evaluation system should be based on that country’s academic circumstances. Most scholarly journals published in Indonesia are not listed in Scopus or Web of Science. Therefore, a new local system incorporating locally appropriate metrics is required. This is a good example of such a system, and it was possible to incorporate the S-score in the Indonesian portal system (SINTA). Therefore, these new metrics could enrich the Indonesian database portal.
There were some limitations to this study. It was difficult to identify and match researchers through Google Scholar because some researchers did not have photos and the author’s name in the profile was not always the same as that in articles. Affiliations in Google Scholar and Scopus were often different from the current affiliations. Therefore findig out a precise number of publication from an institution is difficult and the data integrity should be pursued continuously. Another problem in the implementation of the S-score in SINTA is normalization; it is challenging to make comparisons among authors, disciplines, or institutions because research products vary according to the research category. Key items for evaluating performance were developed in this study and implemented in the SINTA portal based on a variety of items, including the number of citations in Google Scholar (Table 3); however, Google Scholar cannot be used as a key item because the quality of data was not consistent.
Conclusion
In the future, SINTA needs to adopt a normalized measurement method [6]. Normalization takes into account the following parameters: the average number of citations per publication (excluding self-citations); the percentage of publications without a citation, the average number of journal citations, and the performance of research units in related fields around the world. Measurements of research performance to be implemented within the SINTA must consider interdisciplinary and transdisciplinary areas, as some measures may not be adequate for such areas.
The h-index and some of its modifications are useful for quantifying the performance of researchers, similarly to the rankings of universities, and this is necessary in a global environment [7,8]. Rankings will be announced periodically (4 times a year) because real-time rankings may confuse policy-makers if rankings serve as a tool for rewards and penalties based on research performance.
The journal classification (S1–S6) should be considered as a determinant of Indonesian journals. This ranking system may be adopted by other local countries. Table 2 contains broadly applicable items for journal evaluation. The S-score of researchers and institutions is also based on the number of publications, citations, and h-index; therefore, this system will serve as a model to be referred to by other countries.
A new metric, referred to as the S-score, for measuring the performance of researchers, institutions, and journals in Indonesia was proposed and successfully integrated into the SINTA portal. Its validity and reliability should be monitored consistently through regular assessments of S-scores. This may be a good example of a metric suitable for measuring the performance of researchers, institutions, and journals in a country where most journals are not indexed in Scopus.
Notes
No potential conflict of interest relevant to this article was reported.
Acknowledgements
This study was supported by a research grant provided by the Insentif Sistem Inovasi Nasional (Insinas) Programme of the Ministry of Research, Technology, and Higher Education of Indonesia Government (grant no. 62/P/RPL-LIPI/INSINAS-2/VI/2017).