
Articles
- Page Path
- HOME > Sci Ed > Volume 10(1); 2023 > Article
-
Original Article
Comparison of the open access status and metrics of Scopus journals published in East Asian countries: a descriptive study -
Eungi Kim1
 , Da-Yeong Jeong2
 -
Science Editing 2023;10(1):57-63.
DOI: https://doi.org/10.6087/kcse.297
Published online: February 16, 2023
1Department of Library and Information Science, Keimyung University, Daegu, Korea
2Independent researcher, Yeongcheon, Korea
- Correspondence to Eungi Kim egkim@gw.kmu.ac.kr
Copyright © 2023 Korean Council of Science Editors
This is an open access article distributed under the terms of the Creative Commons Attribution License (https://creativecommons.org/licenses/by/4.0/), which permits unrestricted use, distribution, and reproduction in any medium, provided the original work is properly cited.
- 1,964 Views
- 233 Download
- 1 Crossref
Abstract
-
Purpose
- The objective of this study was to compare Scopus journals published in East Asian countries—China, Japan, South Korea, and Taiwan—in terms of their open access status and metrics and to explore the implications of those findings for South Korea.
-
Methods
- To conduct this study, we selected four East Asian countries: China, Japan, South Korea, and Taiwan. We used journal information provided by SCImago Journal Rank (SJR) and Scopus. The following parameters were analyzed for journals published in East Asian countries: open access status, subject categories, quartiles, number of published documents, h-index, publishers, and citation rate.
-
Results
- In all East Asian countries, numerous commercial publishers publish journals. One exception is Science Press, a Chinese government-sponsored publisher, which published the largest number of journals in the East Asian region. Japan had the highest median number of years covered by SJR. However, the proportion of Q1 journals in Japan was the lowest of the East Asian countries. South Korea had the highest proportion of Q1 journals in the country’s total journal production. Publishers in South Korea published more open access journals than any other East Asian country. Despite publishing a high proportion of prestigious journals, South Korea lagged behind China and Japan in the number of Scopus-indexed journals.
-
Conclusion
- The findings indicate that South Korea has made significant progress in locally producing influential journals over the years. However, more efforts to publish international journals are required for South Korea to increase the number of Scopus journals.
- Background/rationale
- East Asian countries—including, most notably, China, Japan, South Korea, and Taiwan—are among the most important countries in the world regarding trade and technology. Like many other countries, these East Asian countries compete to increase their scientific innovation and research output [1]. One way to increase a country’s scientific output is to encourage local publishers to publish international journals.
- In South Korea, the Korean government has supported Korean journals through the National Research Foundation of Korea (NRF) in recent decades. The NRF’s Korean Citation Index (KCI) is important for Korean journals, although it mainly aims to support Korean domestic research regardless of its inclusion in international databases [2]. As pointed out by Shin [3], the number of English-language international journals should be increased in order to publish a large number of prestigious international journals.
- From this standpoint, it would be useful to compare and analyze the journals published in East Asian countries using various journal indicators to assess the current status of journal publishing. Many previous studies have examined the research output of Asian countries [4–6]. However, except for Lin [7] and Xia et al. [8], comparative studies on academic journals published in East Asian countries are difficult to find. The results of this study will help to identify the weaknesses and strengths of each Asian country in journal publishing.
- Objectives
- The objective of this study was to compare Scopus journals published in East Asian countries in terms of their open access (OA) status and metrics.
Introduction
- Ethics statement
- This study was conducted based on bibliographic data provided by Scopus and SCImago Journal Rank (SJR). Neither approval of the Institutional Review Board nor informed consent was required.
- Study design
- This was a quantitative descriptive analysis comparing journals published in East Asian countries.
- Data sources/measurement
- To conduct this study, we selected four East Asian countries—China, Japan, South Korea, and Taiwan—and downloaded various journal information from SJR. SJR could be used as a proxy for journals published in Scopus, since it contains information on journals indexed in Scopus. Among the journals indexed in both Scopus and SJR in 2021, the distribution of journals published in East Asian countries was as follows: 749 journals in China, 400 journals in Japan, 297 journals in South Korea, and 98 journals in Taiwan. Based on the downloaded data, we analyzed the journals published in these East Asian countries in terms of OA status, subject categories, quartiles, number of published documents, h-index (journal), publishers, and citation ratio. The years covered were not provided by SJR but were calculated using the coverage years. We also analyzed the subject categories of the journals published in East Asian countries using the All-Science Journal Classification (ASJC) codes. All journals indexed by Scopus are categorized using the ASJC codes, which represent the subject categories of Scopus-indexed journals. We extracted the ASJC codes from the Scopus journal list published in October 2021. The R language (R Foundation for Statistical Computing) was used to join the information between the Scopus journal list and the SJR journal data and to analyze the journal data. A list of the journals and their attributes is provided in Dataset 1.
- Statistical methods
- Descriptive and comparative analyses were performed using Microsoft Excel (Microsoft Corp) and the R language ver. 4.2.2. One-way analysis of variance (ANOVA) was performed to determine whether differences among the four East Asian countries in quartile, h-index, total documents, and the 2-year citation ratio were statistically significant.
Methods
- OA journals versus non-OA journals
- We examined the OA status of journals published in East Asian countries (Table 1). SJR uses the OA status of its published journals from the Directory of Open Access Journals (DOAJ) and the Directory of Open Access Scholarly Resources (ROAD) [9]. These listed journals are considered “fully” OA and not hybrid. By offering OA options to the authors, hybrid journals publish some, but not all, articles as OA. Table 1 illustrates that China had the lowest proportion of OA journals compared to the other nations. As a result, China had the greatest relative percentage (84.8%) of non-OA (subscription) journals produced among the other countries. In contrast, South Korea published the highest number (159 journals, 53.5%) of OA journals. Thus, the relative proportion of non-OA journals published in South Korea was lower (46.5%) than in other countries. The chi-square test was performed to determine whether the difference in OA status among the four East Asian countries was statistically significant. The chi-square statistic was 168.5, and the P-value was <0.001; thus, the result was significant at P<0.05.
- In this study, the OA status of journals published in South Korea was manually checked (December 15–20, 2022). As shown in Dataset 1, a substantial number of “non-OA” journals published in South Korea according to the initial analysis were actually OA journals or could be categorized as OA journals. There were a few journals transitioning from non-OA to OA. A journal that is categorized as “free” can be considered an OA journal because its articles are publicly accessible on its website or through other portals. Most of these journals do not claim to be OA and do not have explicit statements to that effect in their copyright transfer agreements. The OA status as determined using SJR differs substantially from the actual current status. In total, 52 Korean journals indexed in Scopus as non-OA could have been classified as OA, while 39 (28.3%) could have been classified as “free.”
- Analysis of basic journal indicators
- Table 2 shows the quartiles of journals published in East Asian countries. The SJR score is calculated by assigning weights to bibliographic citations based on the importance of the journals that issued them [10]. The quartile status is useful because it is a field-normalized indicator that reflects the SJR scores in that field. SJR divides its indexed journals into four quartiles: Q1, Q2, Q3, and Q4. China published the most Q1 and Q4 journals when compared to other nations. However, South Korea had the highest proportion (15.2%) of Q1 journals relative to the country’s total journal production. Taiwan published the fewest Q1 journals (10 journals), but Japan published the lowest proportion (8.5%) of Q1 journals relative to the country’s total journal production.
- Table 3 shows various indicators of journals published in East Asian countries. These include the quartile, h-index, total number of publications in 2020, and the 2-year citation ratio. Consistent with Table 1, the average quartile of journals published in South Korea was the highest (2.59), whereas the average quartile of journals published in Taiwan was the lowest (3.12). It is worth noting that a lower average quartile value indicates a higher quartile. Regarding the h-index of journals, Japan ranked first, while Taiwan ranked last. China published the most journal documents (166.79) in 2020. In terms of the 2-year citation ratio, South Korea ranked first (1.68), whereas Japan ranked last (0.99).
- One-way ANOVA was performed to determine whether various obtained results differed significantly among the East Asian countries, and the statistical test revealed the following: (1) the difference in journal quartiles between the East Asian countries was statistically significant (F(3, 1,499)=15.38, P<0.001); (2) the difference in the h-index between the East Asian countries was statistically significant (F(3, 1,540)=11.54, P<0.001); (3) the difference in the total number of published documents between the East Asian countries in 2020 is statistically significant (F(3, 1,540)=72.00, P<0.001); and (4) the difference in the 2-year citation ratio between the East Asian countries was statistically significant (F(3, 1,540)=8.46, P<0.001).
- Top publishers
- Table 4 shows the top 10 publishers in the East Asian countries that published the largest number of journals. As shown, many top journal publishers in East Asian countries are global commercial publishers from Western countries. These include Elsevier, Wiley-Blackwell, and Springer Nature. Science Press, partly owned by the Chinese Academy of Sciences [11], published the largest number (90 journals) of journals in China. Techno-Press, a Korean commercial publisher of international journals and conference proceedings, published the largest number (14 journals) of journals in South Korea. Except for Techno-Press, other top publishers in South Korea published only a small number of Scopus-indexed journals. Another notable publishing pattern in South Korea is that no university press was found among the top 10 publishers. The top publishers in South Korea are commercial publishers, nonprofit institutions, associations, and societies.
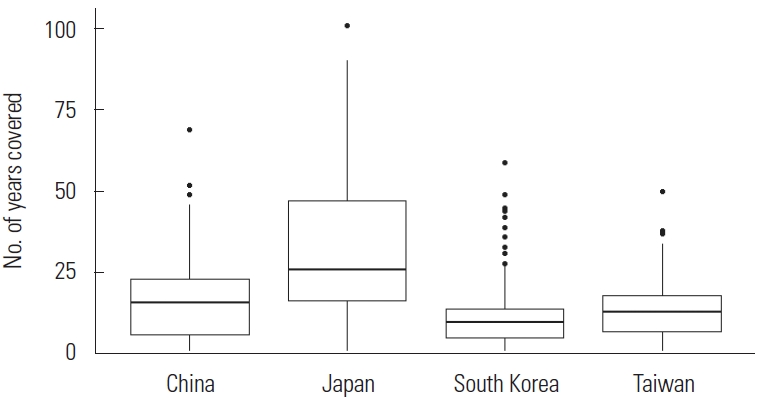
- Number of years covered
- Fig. 1 is a boxplot exhibiting the number of years covered by SJR, which is equivalent to the number of years covered by Scopus. The median number of years covered by SJR was highest for Japanese journals and lowest for South Korean journals. The low number of median years covered in Korean journals suggests that most journals published in Korea have been indexed in SJR only in recent years, whereas the high number of median years covered in Japanese journals suggests that a substantial number of Japanese journals indexed by SJR are much older than the journals published in other countries. Although older journals tended to have a higher h-index, the number of years covered by SJR was inconsistent with the average journal h-index shown in Table 3. South Korea ranked last in terms of years covered but second in terms of the h-index in East Asian countries.
- Subject area analysis
- Fig. 2 shows the subject categories of journals published in East Asian countries and their frequencies. The ASJCs shown in Fig. 2 correspond to 27 major subject categories. The number of minor subject categories within major subject categories may range from 00 to 49, and the major subject categories are shown as “**”. Each country publishes SJR-indexed journals in different subject categories. The percentage of journals published in a subject category was analyzed relative to other categories within a country. The number of journals and the percentage of journals published by subject area within a country varied widely. The highest percentage (17.6%) of journals in a country published in the category of engineering (ASJC code, 22**) was found in China, while the percentage of journals published in medicine (ASJC code, 27**) was highest in Japan (22.1%) and South Korea (20.7%). Taiwan published the highest proportion (17.5%) of journals published in the social sciences (ASJC code, 33**). In the arts and humanities (ASJC code, 12**), China published a relatively low proportion of journals in the country, while Taiwan published a relatively high proportion (11.0%). South Korea has published 45 journals (8.9%) in the social sciences (ASJC code, 33**), corresponding to the largest number of journals published among East Asian countries.
Results
- Interpretation
- As shown by Johnson et al. [12], journal production in East Asian countries lags far behind Western countries, such as the United States and the United Kingdom. Each East Asian country showed a distinctive pattern in terms of the indicators analyzed in this study. Overall, journals published in Japan had the highest number of years covered and the highest h-index, but low SJR scores. The high number of median years covered suggests that most journals published in Japan are well-established. Taiwan ranked last in publishing Scopus-indexed journals, but it has the smallest population of these countries.
- As for subject areas, the findings of this study indicate that all of the East Asian countries place more effort into publishing journals related to science and technology. China seems particularly strong in publishing journals in some fields, such as engineering. South Korea has more journals in the social sciences, but it lags far behind China in international journal publishing in an important science and technology category—namely, engineering. The findings also show that China is relatively weak in publishing journals in the humanities compared to other fields, based on the relative percentage of journals published in this country. South Korea publishes the most social science journals, though Taiwan publishes the most in terms of the proportion of journals published in this country.
- Regarding journal type, South Korea is a competitive producer of prestigious journals in East Asia. The relatively high proportion of South Korea’s OA journals is consistent with previous research [3] in that journals published in South Korea have been switching over to OA. The fact that South Korea has published more OA journals than other East Asian countries may have contributed to more citations. Despite publishing a high proportion of prestigious journals, South Korea lags behind China and Japan in the publication of Scopus-indexed journals. In terms of journal publishers, the most noticeable difference between South Korea and China is that, unlike in South Korea, a government-owned publisher (Science Press) has led journal production in China.
- Limitations
- This study was limited to journals indexed in Scopus. We did not consider journals indexed in other databases. Furthermore, this study relied on journal information provided by SJR. OA journals listed in SJR were identified based on DOAJ and ROAD. Regarding South Korea, although many local OA journals were not listed in these databases, the published journal articles are generally freely available under the Creative Commons Attribution License [13]. Thus, there is actually a larger number of OA journals in South Korea than indicated in the SJR.
- Conclusion
- The results show that South Korea has made significant progress in creating important local journals over time. To increase the number of Scopus journals, South Korea needs to make more efforts to publish international journals. In addition, many OA journals published in South Korea are still not registered with DOAJ. Publishers should immediately register their journals with DOAJ to be recognized as OA journals.
Discussion
-
Conflict of Interest
No potential conflict of interest relevant to this article was reported.
-
Funding
The authors received no financial support for this article.
-
Data Availability
Dataset file is available from the Harvard Dataverse at https://doi.org/10.7910/DVN/KI6VS2.
Dataset 1.A list of the journals and their attributes collected from SCImago Journal Rank and Scopus.
Notes

| Journal type | China (n = 749) | Japan (n = 400) | South Korea (n = 297) | Taiwan (n = 98) |
|---|---|---|---|---|
| OA | 114 (15.2) | 95 (23.8) | 159 (53.5) | 36 (36.7) |
| Non-OA (subscription) | 635 (84.8) | 305 (76.3) | 138 (46.5) | 62 (63.3) |
| Indicator | China | Japan | South Korea | Taiwan | F-statistic | P-value |
|---|---|---|---|---|---|---|
| Quartile | 3.01 | 3.07 | 2.59 | 3.12 | 15.38 | < 0.001 |
| H-index | 20.64 | 26.97 | 20.96 | 17.37 | 11.54 | < 0.001 |
| Total documenta) | 166.79 | 66.55 | 75.53 | 55.31 | 72.00 | < 0.001 |
| 2-Year citationb) | 1.57 | 0.99 | 1.68 | 1.02 | 8.46 | < 0.001 |
- 1. Park H, Park HW. Research evaluation of Asian countries using altmetrics: comparing South Korea, Japan, Taiwan, Singapore, and China. Scientometrics 2018;117:771-88.https://doi.org/10.1007/s11192-018-2884-6. Article
- 2. Kim S. A study on the improvement of Korean journal citation index service. Int J Knowl Content Dev Technol 2021;11:63-79.https://doi.org/10.5865/IJKCT.2021.11.3.063. Article
- 3. Shin EJ. Scholarly journal publishing and open access in South Korea. Serials Rev 2012;38:99-104.https://doi.org/10.1016/j.serrev.2012.05.001. Article
- 4. Meo SA, Al Masri AA, Usmani AM, Memon AN, Zaidi SZ. Impact of GDP, spending on R&D, number of universities and scientific journals on research publications among Asian countries. PLoS One 2013;8:e66449. https://doi.org/10.1371/journal.pone.0066449. ArticlePubMedPMC
- 5. Moed HF, Halevi G. Tracking scientific development and collaborations: the case of 25 Asian countries. Res Trends 2014;1:25-30.https://www.researchtrends.com/researchtrends/vol1/iss38/8.
- 6. Jung J, Horta H. The contribution of East Asian countries to internationally published Asian higher education research: the role of system development and internationalization. High Educ Policy 2015;28:419-39.https://doi.org/10.1057/hep.2015.15. Article
- 7. Lin WY. The performance of Asian S&T journals in international citation indicators. Learn Publ 2017;30:193-204.https://doi.org/10.1002/leap.1100. Article
- 8. Xia J, Li Y, Situ P. An overview of predatory journal publishing in Asia. J East Asian Libr 2017;2017:4. https://scholarsarchive.byu.edu/jeal/vol2017/iss165/4.
- 9. Steiginga S, Evans I. Finding open-access journals on Scopus keeps getting easier: Journal Indicator search makes OA journals more visible among 22,000+ titles [Internet]. Elsevier; 2015 [cited 2022 Oct 10]. Available from: https://www.elsevier.com/connect/finding-open-access-journals-on-scopus-keeps-getting-easier.
- 10. González-Pereira B, Guerrero-Bote VP, Moya-Anegón F. A new approach to the metric of journals’ scientific prestige: the SJR indicator. J Informetr 2010;4:379-91.https://doi.org/10.1016/j.joi.2010.03.002. Article
- 11. EDP Sciences. EDP Sciences joins forces with the Chinese Academy of Sciences and its publisher Science Press Ltd. [Internet]. EDP Sciences; 2019 [cited 2022 Oct 10]. Available from: https://www.edpsciences.org/en/news-highlights/1964-edp-sciences-joins-forces-with-chinese-academy-of-sciences-and-its-publisher-science-press-ltd.
- 12. Johnson R, Watkinson A, Mabe M. The STM report: an overview of scientific and scholarly publishing. 5th ed. International Association of Scientific, Technical and Medical Publishers; 2018.
- 13. Seo YJ, Cho HM, Huh S. Changes in bibliographic information associated with Korean scientific journals from 2011 to 2019. Sci Ed 2020;7:11-5.https://doi.org/10.6087/kcse.184. Article
References
Figure & Data
References
Citations
- In-Depth Examination of Coverage Duration: Analyzing Years Covered and Skipped in Journal Indexing
Eungi Kim
Publications.2024; 12(2): 10. CrossRef
 PubReader
 ePub Link
 Cite
Cite


